100 participants took part in a study on the relationship between subjective workload and system usability in the use of voice user interfaces.
Participants were invited to complete a set of 10 everyday tasks with Amazon Alexa via an Echo smart speaker. After completing the tasks, participants were asked to complete two questionnaires, the Raw NASA Task Load Index (RTLX - Hart & Staveland, 1988; Hart 2006) and the System Usability Scale (Brooke 1996).
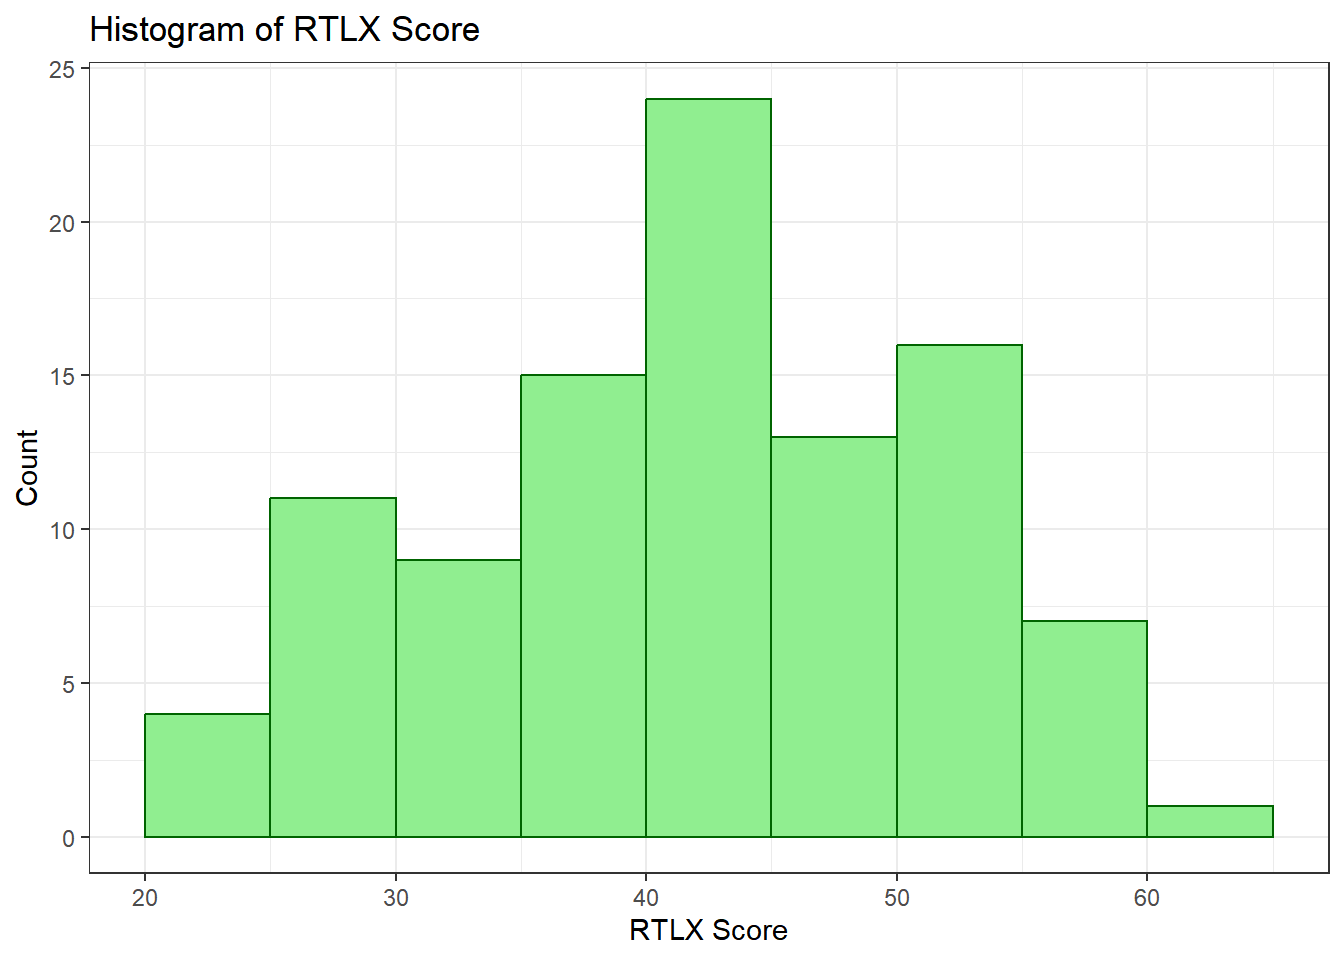
The RTLX is a 6 item, 21 point questionnaire on which people are asked to rate the subjective workload of a task across dimensions including mental demand, physical demand, temporal demand, performance, effort and frustration.The scale ranges from a minimum total score of 0 to a maximum of 126.
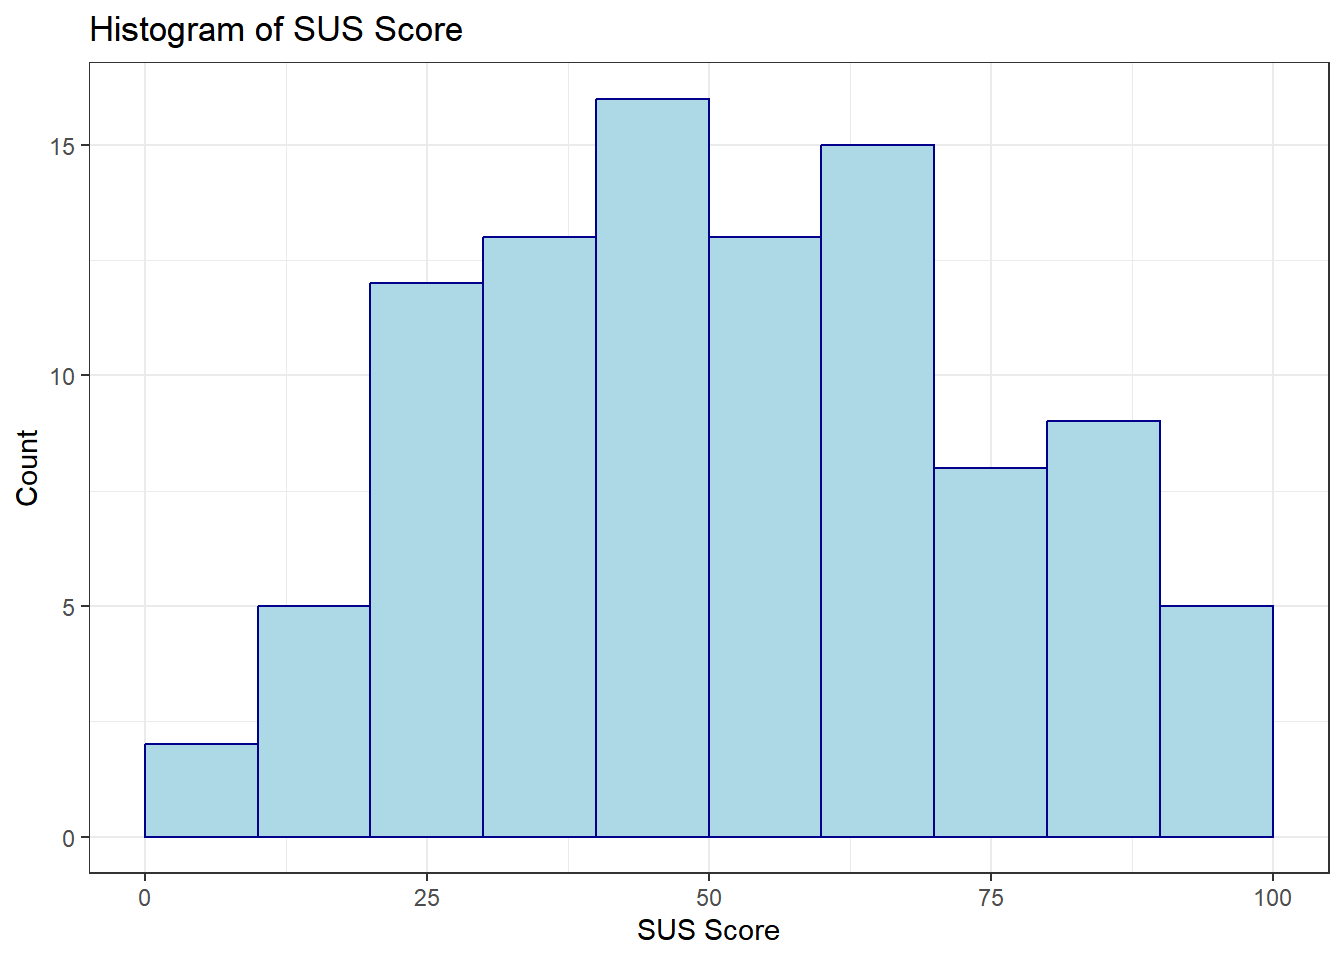
The SUS is a 10 item 5 point Likert scale questionnaire (ranging from 0 to 4) measuring the perceived usability of a computer system. The scale ranges from a minimum total score of 0 to a maximum total score of 100, as scores are summed and then multiplied by 2.5.
Analysis Task
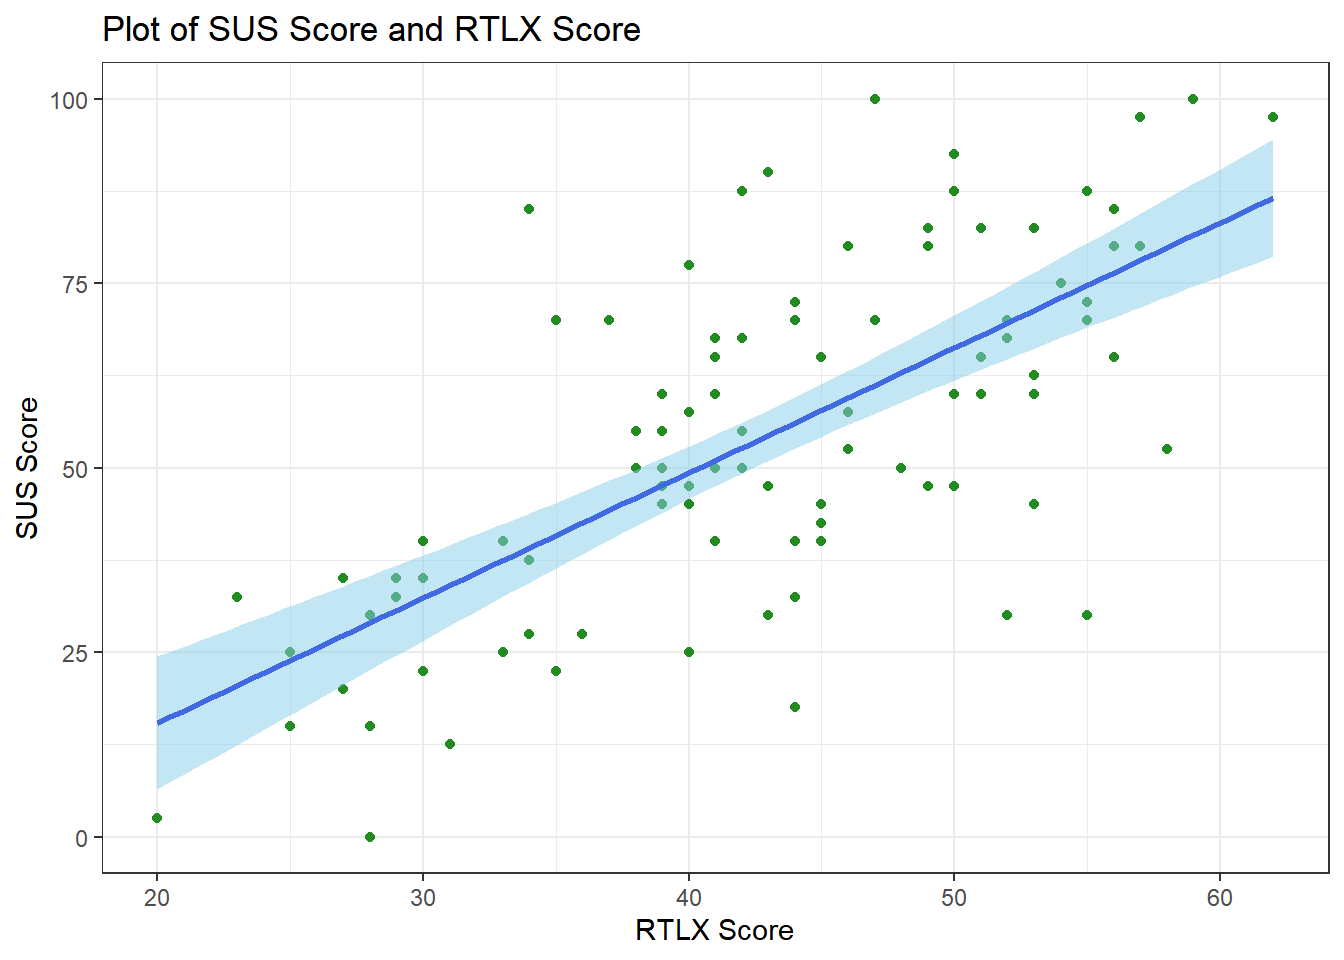
Analyse the data in R to research the following experimental hypothesis: H1: There will be a statistically significant relationship between RTLX and SUS.
Rows: 100 Columns: 3
── Column specification ────────────────────────────────────────────────────────
Delimiter: ","
dbl (3): ID, SUS.Score, RTLX.Score

ℹ Use `spec()` to retrieve the full column specification for this data.
ℹ Specify the column types or set `show_col_types = FALSE` to quiet this message.
# A tibble: 1 × 7
N min max mean sd median IQR
<int> <dbl> <dbl> <dbl> <dbl> <dbl> <dbl>
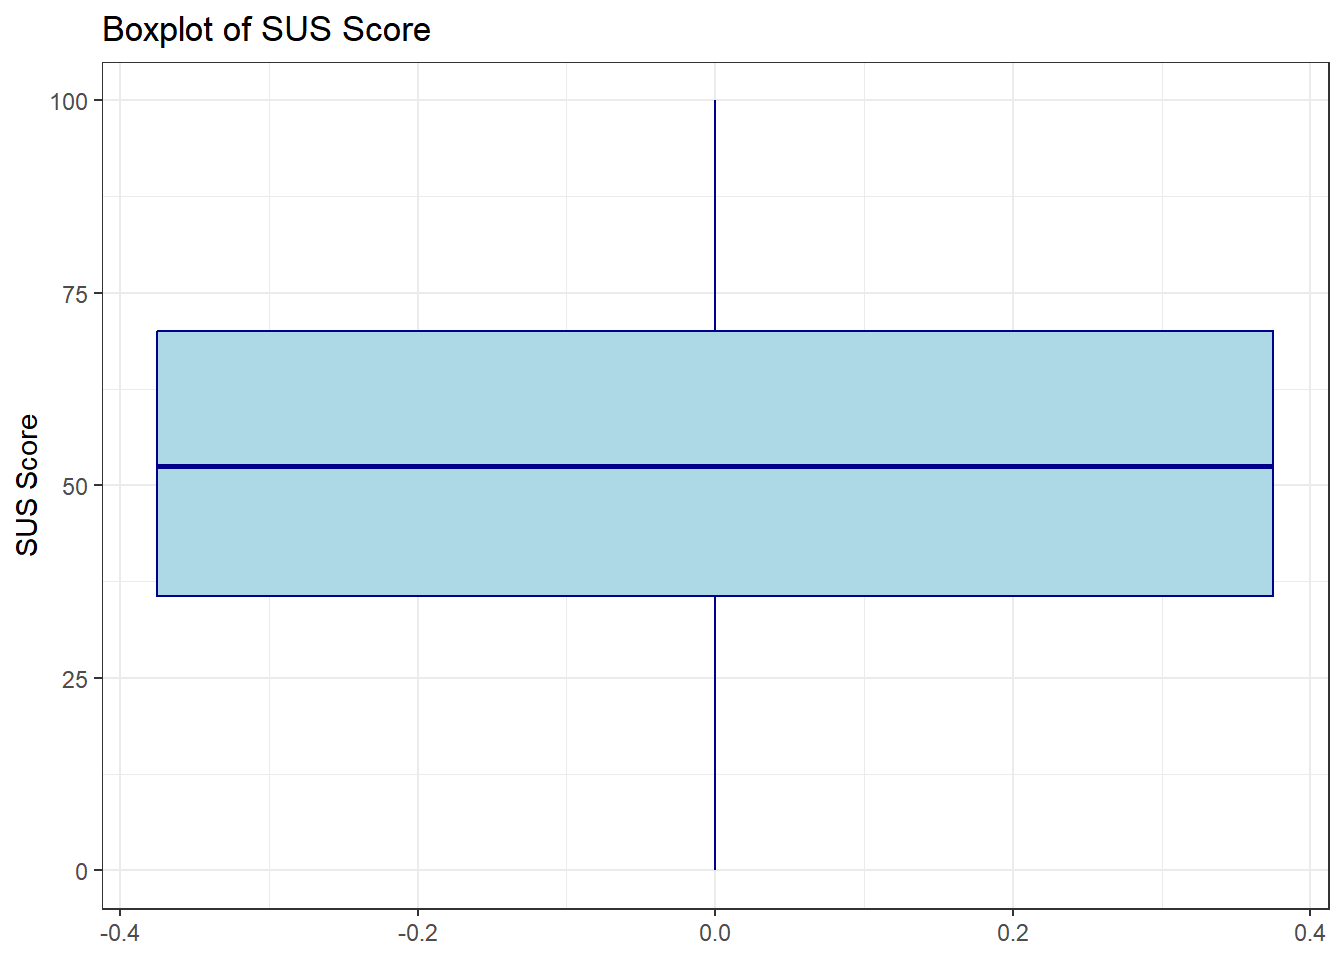
1 100 0 100 53.7 23.3 52.5 34.4
Scores$RTLX.Score |>statistics()
# A tibble: 1 × 7
N min max mean sd median IQR
<int> <dbl> <dbl> <dbl> <dbl> <dbl> <dbl>
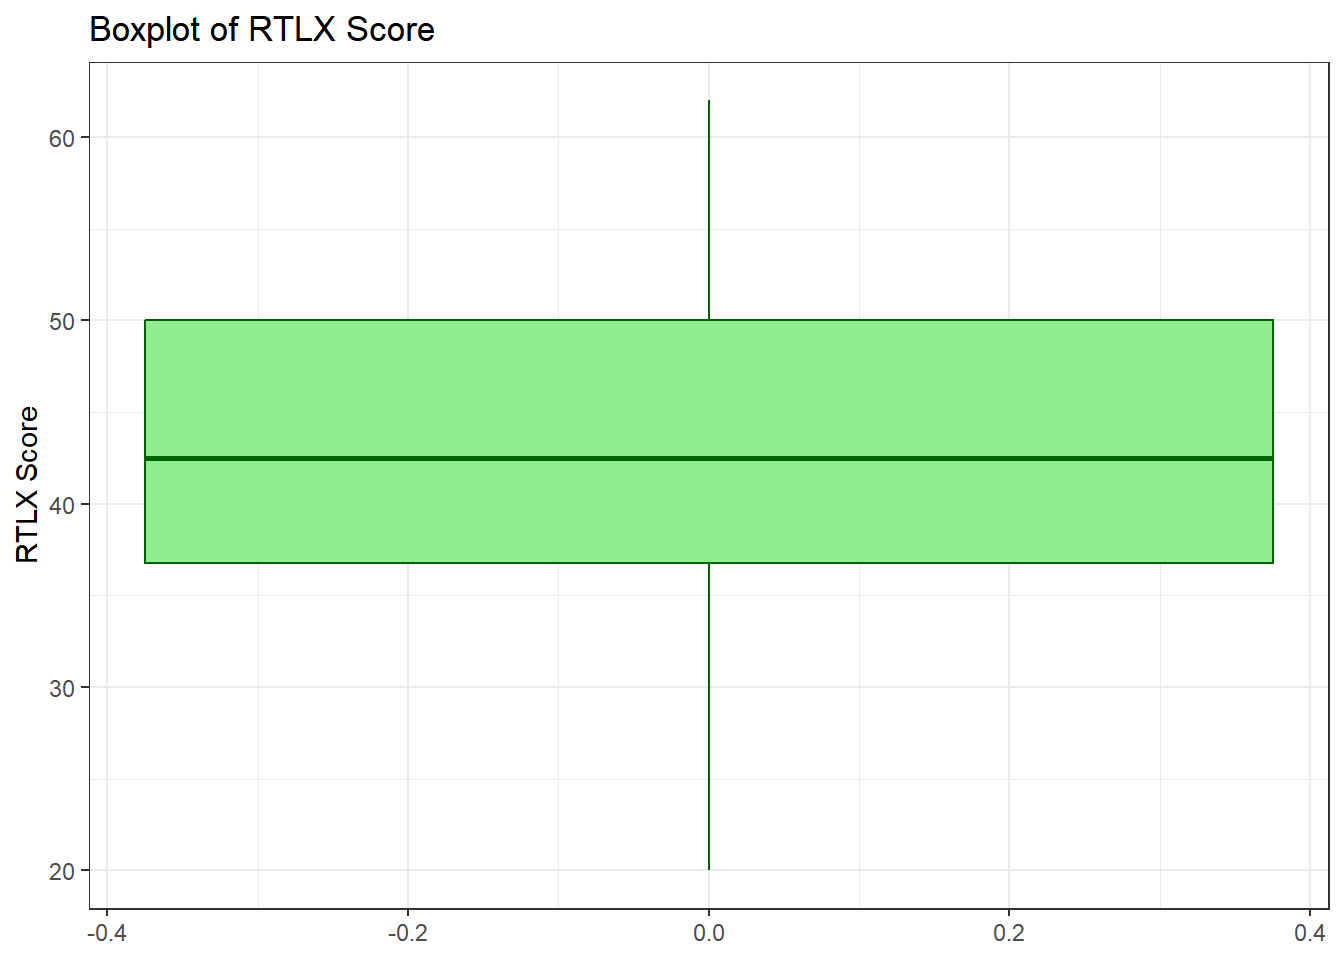
1 100 20 62 42.6 9.41 42.5 13.2
Draw Plot
Scores |>filter(!is.na(SUS.Score)) |>ggplot(aes(SUS.Score)) +geom_histogram(aes(, after_stat(count)),binwidth =10, center =5,color ="darkblue", fill ="lightblue") +ggtitle("Histogram of SUS Score") +xlab("SUS Score") +ylab("Count") +theme_bw()
Scores |>filter(!is.na(RTLX.Score)) |>ggplot(aes(RTLX.Score)) +geom_histogram(aes(, after_stat(count)),binwidth =5, boundary =5,color ="darkgreen", fill ="lightgreen") +ggtitle("Histogram of RTLX Score") +xlab("RTLX Score") +ylab("Count") +theme_bw()
Scores |>filter(!is.na(SUS.Score)) |>ggplot(aes(, SUS.Score)) +geom_boxplot(color ="darkblue", fill="lightblue") +ggtitle("Boxplot of SUS Score") +ylab("SUS Score") +theme_bw()
Call:
lm(formula = SUS.Score ~ RTLX.Score)

Residuals:
    Min      1Q  Median      3Q     Max
-44.728 -11.402   0.122  11.098  45.862

Coefficients:
            Estimate Std. Error t value Pr(>|t|)
(Intercept)  -18.484      8.111  -2.279   0.0249 *
RTLX.Score     1.695      0.186   9.110 1.22e-14 ***
---
Signif. codes:  0 '***' 0.001 '**' 0.01 '*' 0.05 '.' 0.1 ' ' 1

Residual standard error: 17.17 on 96 degrees of freedom
Multiple R-squared:  0.4637,    Adjusted R-squared:  0.4581
F-statistic: 82.99 on 1 and 96 DF,  p-value: 1.216e-14
Result
Experiment hypothesis H1: There will be a statistically significant relationship between RTLX and SUS was supported
Discussion
My intuitive assumption is that there is a negative relationship between system usability and subjective workload, but the finding indicates a positive relationship between them.
The outcome also contradicts the result of another experiment conducted by Longo and Dondio (2015) in which they found that there is no relationship between them.
I found that the standard deviation and the interquartile range of RTLX are substantially smaller than those of SUS, which means that although participants in this experiment had similar judgments about subjective workload, their assessments about system usability are considerably different.
This situation could be caused by the limitations of the experiment which overlooked differences between tasks and diversity of participants.
Reference
Brooke, J. (1996). SUS-A quick and dirty usability scale. Usability evaluation in industry, 189(194), 4-7.
Hart, S. G., & Staveland, L. E. (1988). Development of NASA-TLX (Task Load Index): Results of empirical and theoretical research. In Advances in psychology (Vol. 52, pp. 139-183). North-Holland.
Hart, S. G. (2006). NASA-task load index (NASA-TLX); 20 years later. In Proceedings of the human factors and ergonomics society annual meeting (Vol. 50, No. 9, pp. 904-908). Sage CA: Los Angeles, CA: Sage publications.
Longo, L., & Dondio, P. (2015). On the relationship between perception of usability and subjective mental workload of web interfaces. In 2015 IEEE/WIC/ACM International Conference on Web Intelligence and Intelligent Agent Technology (WI-IAT) (Vol. 1, pp. 345-352). IEEE.
Wu, Y., Edwards, J., Cooney, O., Bleakley, A., Doyle, P. R., Clark, L., … & Cowan, B. R. (2020). Mental workload and language production in non-native speaker IPA interaction. In Proceedings of the 2nd Conference on Conversational User Interfaces (pp. 1-8).